News
- July 1, 2026: Competition kickoff. We are excited to announce the official launch of the 2026 GeoAI Arctic Challenge. Read welcoming words here.
- July 1, 2026: Public training data, hidden-label test images, starter scripts, and validation tools are released through the Hugging Face dataset repository.
- August 15, 2026: Benchmark phase starts. Organizers will add approved Hugging Face usernames to the submission portal so registered teams can submit predictions and view leaderboard rankings.
The 2026 GeoAI Arctic Challenge invites participants to develop GeoAI and deep learning models for mapping retrogressive thaw slumps (RTS) from multimodal Arctic remote sensing data.
This Cyber2A website is the main information hub for the challenge, including the overview, rules, dataset documentation, submission format, resources, and updates.
Submission Platform: GeoAI Arctic Challenge Submission Portal on Hugging Face
The public challenge website, dataset repository, starter files, and submission-format documentation are available before the benchmark phase. Participants can download the dataset, review the challenge materials, train models, and validate submissions locally. Benchmark submissions and leaderboard rankings open on August 15, 2026, after approved Hugging Face usernames are added to the submission portal.
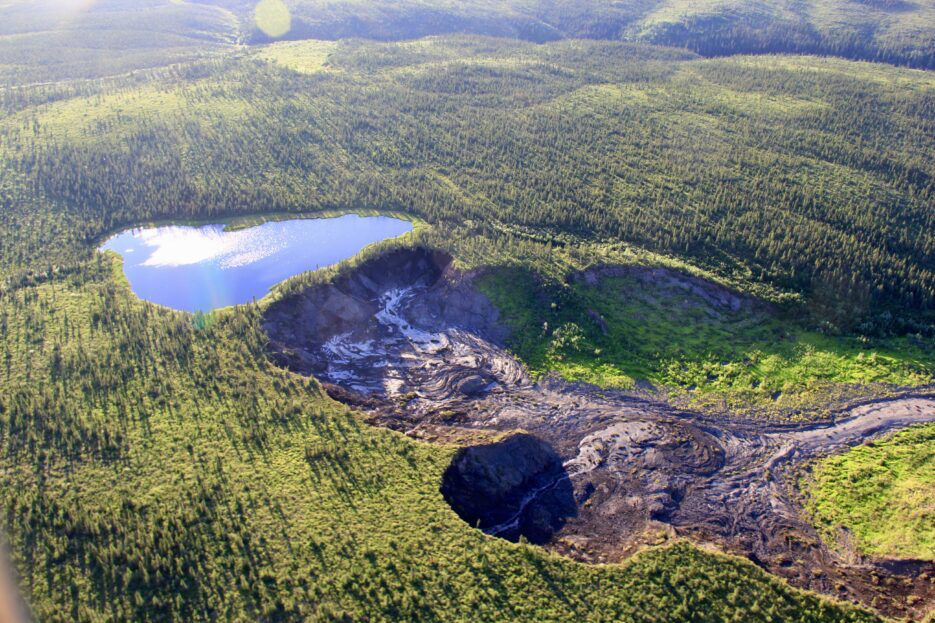
RTS are landslide-like landforms that occur when ice-rich permafrost thaws and collapses. As Arctic warming accelerates, these features are becoming more frequent and can reshape landscapes, alter hydrology, affect ecosystems, and mobilize long-frozen carbon.
Challenge Task
Participants will train models to detect and delineate individual RTS features in Arctic image chips.
| Input | Output |
|---|---|
Eight-band .npz image chip |
One mask for each predicted RTS instance |
The challenge is an instance segmentation task. Training labels are provided in COCO instance segmentation format. Test labels are hidden and used by the official scorer.
Why This Matters
Mapping RTS manually across Arctic regions is difficult because these landforms can be small, visually subtle, and dynamically changing. Automated mapping can help scientists monitor permafrost degradation, improve environmental change detection, and better understand climate-driven Arctic landscape transformation.
How To Start
- Form a team of 1 to 5 members.
- Create a Hugging Face account for each team member.
- Complete the team registration form here.
- Include the exact Hugging Face username for the Team Leader and each team member in the registration form.
- Visit the Hugging Face submission portal.
- Click Login with Hugging Face in the left sidebar to sign in and link your submission account.
- Before August 15, 2026, download the dataset, review the challenge materials, train your model, and validate your
submission.jsonlocally. - Starting August 15, 2026, approved usernames will be added to the submission portal. Use New submission to upload predictions and My submissions to review team submission history.
Note: Public challenge materials remain available before the benchmark phase. Submissions and leaderboard rankings are enabled starting August 15, 2026 for approved Hugging Face usernames only.
Important Dates
| Event | Date |
|---|---|
| Competition opens | July 1, 2026 |
| Dataset released | July 1, 2026 |
| Benchmark phase starts; submissions and leaderboard rankings open | August 15, 2026 |
| Final submission deadline | January 31, 2027 |
| Winners announced | March 1, 2027 |
Awards
Top-performing teams will receive cash awards and recognition:
| Place | Award |
|---|---|
| 1st place | $1,000 |
| 2nd place | $500 |
| 3rd place | $200 |
Selected participants may also be invited to contribute to an outcome publication and future research collaborations.
Dataset Preview
The dataset contains high-resolution, multimodal satellite image chips paired with RTS instance segmentation labels. RGB composites are shown below for visualization only; the modeling input contains eight channels.
| Input: RGB composite | Target: RTS instances |
|---|---|
 |
 |
 |
 |
Partners


![]()
Sponsors

Contact
For competition support, contact wenwen@asu.edu or chiayuhsu@asu.edu.
For technical questions that may help other teams, use the discussion area on the Hugging Face submission portal. You may also contact the organizing team by email.